Tag / r
-
![]()
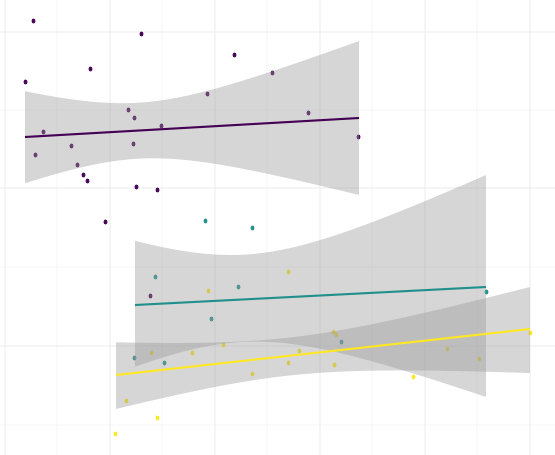
Is there a relationship between teacher salary and their student’s SAT scores?
Among some of the amazing talks from Cognitive Systems Institute Group Speaker Series, one of the most wonderful is the talk made by Mine Cetinkaya-Rundel about “Teaching Data Science”. One of the examples presented by her was about the salary teachers and the relationship with the SAT. In this very simple example, we can apply linear regression,…
-
![]()
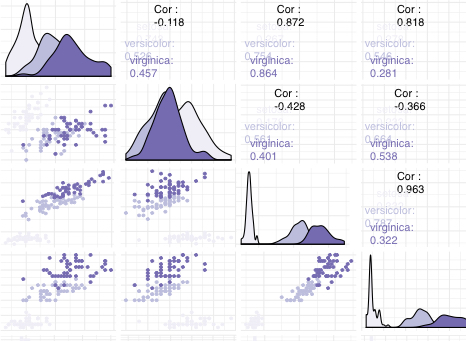
How to show correlations between variables?
When we work with linear regression we need to understand the relationship between the variables, that is, which variables depend on others, for this we analyze the correlation between the different variables that make up our dataset. Below is an example using ggally one of the many libraries that allow us to perform this analysis…
-
![]()
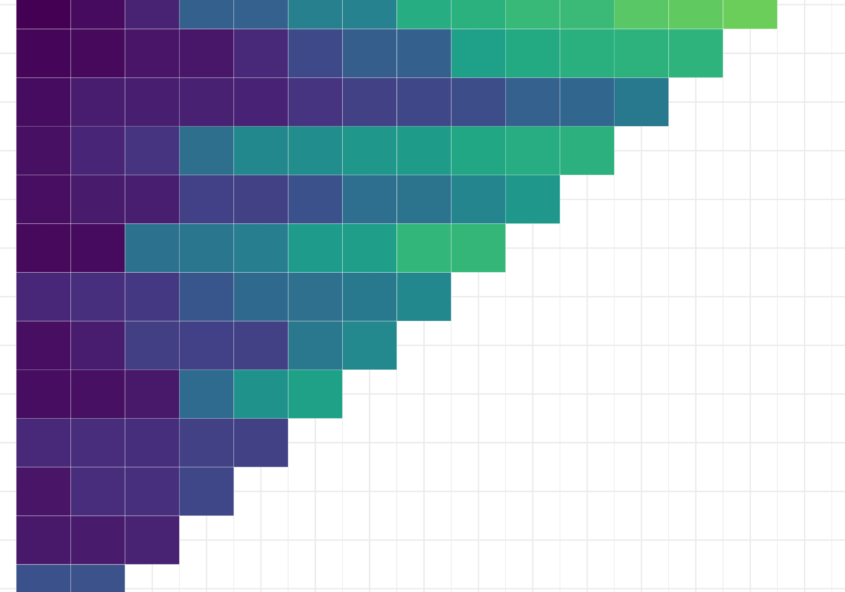
How to create a Heatmap (II): heatmap or geom_tile
Heatmaps visualise data through variations in colouring. There are different functions to create a heatmap, one of them is using the heatmap function, but it is also possible to create a heatmap using geom_tile from ggplot2. The election for one of these function relies on the dataset. Below there is an example developed step by…
-
![]()
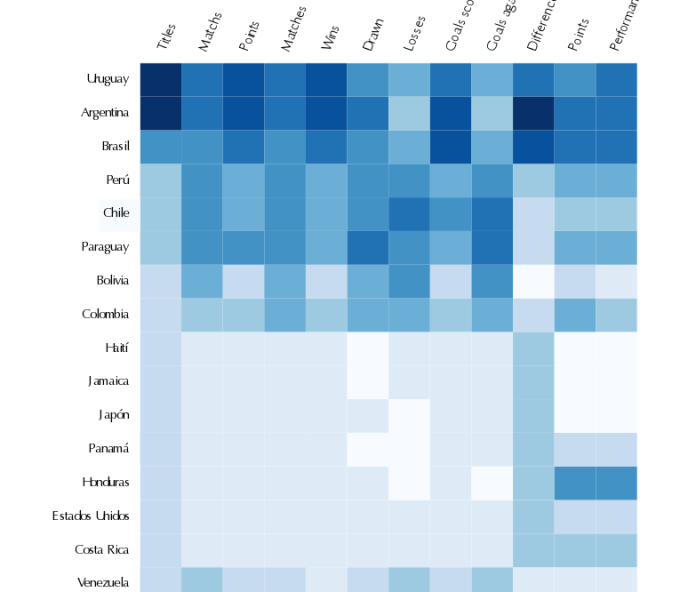
How to create a heatmap (Updated!)
A heatmap is basically a table that has colors in place of numbers. Colors correspond to the level of the measurement. Each column can be a different metric like above. It’s useful for finding highs and lows and sometimes, patterns. From Nathan Yau | Visualize This One of the problems when we have a…
-
![]()
The Viridis palette for R
One of the most important things about graphs is the election of the colors. Color could change the mood of the image, or impact the story, also guide the viewer thought the elements into the visualization. The election of colors is notably important. The physics, technology, and neuroscience behind the interpretation of colors is surprisingly…
-
![]()
Black box: SVN – Support Vector Machines
Idea Luego de analizar que significa SVN, vamos a ver la implementacion practica en un problema cotidiano: como funciona el reconocimiento de imagenes, y en particular vamos a intentar replicar el funcionamiento de los sistemas de OCR (Optical Character Recognition). Vamos a utilizar el dataset donado a la UCI Machine learning Data Reposity compuesto por…
-
![]()
Deep learning: Neural network
Vamos a implementar una red neuronal utilizada para prediccion de valores. Idea Vamos a trabajar para poder predecir la fortaleza del concreto, si bien es un material amplisimamente utilizado, debido a que esta compuesto por una gran cantidad de materiales es dificil precedir su fortaleza en el producto final. El objetivo es predecir la fortaleza…
-
![]()
Multiple lineal regression (II) Improving the model
En este post empezamos a trabajar con linear regression, en esta segunda parte vamos a trabajar para mejorar la performance de nuestro modelo, principalmente agregando relaciones entre variables. Mejorando el modelo Vamos a agregar tres nuevas relaciones a traves de la creacion de tres nuevas variables en nuestro dataset: Cambio de la variable edad de…
-
![]()
Multiple lineal regression (I)
Cuando hablamos de modelos de regresion estamos hablando acerca de analizar relaciones entre variables numericas. Que es regresion? es entender las relaciones entre una variable dependiente (que sera el valor a ser predecido) y una o mas variables independientes (las variables predictoras). La forma mas simple de regresion asume una relacion lineal entre una variable…
-
![]()
Divide and conquer(II) : classification rules
Classification rules representa conocimiento en forma de afirmaciones sencillas de si y no, de forma de poder asignarle una clase a ejemplos que no tienen una clasificacion (todavia). Rule learners son usados de forma similar a los arboles de desicion, de la misma forma que los arboles de desicion permiten ver como se estan estableciendo…