The Viridis palette for R
One of the most important things about graphs is the election of the colors. Color could change the mood of the image, or impact the story, also guide the viewer thought the elements into the visualization.
The election of colors is notably important. The physics, technology, and neuroscience behind the interpretation of colors is surprisingly complex.
Viridis palette
The viridis palette was initially developed for the python package matplotlib, and was implemented in R later. The “option D” (now called “viridis”) was the new default colormap in matplotlib 2.0. All of the colormaps have been merged into the development version of Matplotlib included in matplotlib 1.5.
The Viridis palette was implemented using blues and yellow sequences (and avoiding reds), in order to increase the readability for the visualizations.
All the palettes
Inside the Viridis library there are four options: “magma” (or “A”), “inferno” (or “B”), “plasma” (or “C”), “viridis” (or “D”, the default option).
We are going to analize the viridis option.

Using one palette
Option D – Viridis palette
We can use viridis palette for continuos values into a visualization.

library(ggplot2)
n = 200
image(
1:n, 1, as.matrix(1:n),
col = viridis(n, option = "D"),
xlab = "viridis n", ylab = "", xaxt = "n", yaxt = "n", bty = "n"
)
Using colors one by one
When we are creating a visualization, sometimes could be useful pick by hand some of the colors that we want to use, because even when you can setup the variable as discrete, there are no way to be sure the combination of the colors is well balanced and nice to see, that is something completely arbitrary and subjective.
I used this palette in my post about Ireland referendum, and I chose the colors by hand after testing different combinations.
These are twenty of the colors that belongs to Viridis palette.
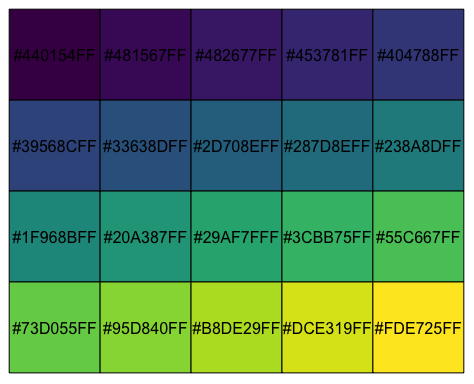
You can set up the number in the code below (in this case 20), and the palette will return the hexa name of colors that you require.
library(scales)
show_col(viridis_pal()(20))
How to check each color from Viridis Palette
Let’s say that you need a set of 15 colours that belong to the Viridis palette. Using the parameter “option” is possible to choose the colormap.
library(scales)
q_colors =  15 # for no particular reason
v_colors =  viridis(q_colors, option = "D")
How to check other palettes options A, B or C
Four options are available: “magma” (or “A”), “inferno” (or “B”), “plasma” (or “C”), “viridis” (or “D”, the default option).
library(scales)
q_colors =  15 # for no particular reason
v_colors =  viridis(q_colors, option = "A")
References
- Understanding colors
- Documentation about viridis package
- Discrete palette
- R documentation about viridis lite package