Tag / visualizations
-
![]()
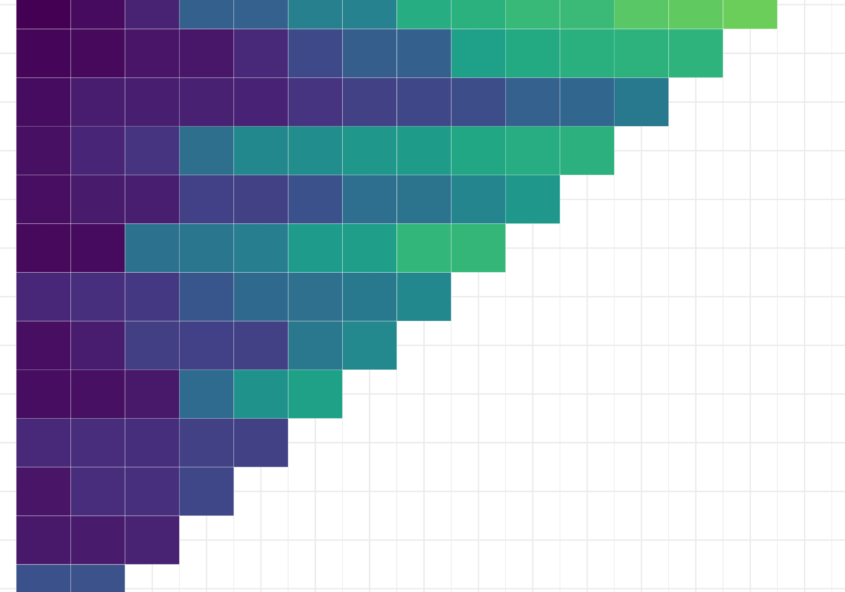
The Viridis palette for R
One of the most important things about graphs is the election of the colors. Color could change the mood of the image, or impact the story, also guide the viewer thought the elements into the visualization. The election of colors is notably important. The physics, technology, and neuroscience behind the interpretation of colors is surprisingly…
-
![]()
6 Tips to make your visualizations look professional [Updated]
When I started working with R, as any beginner I wanted a code that really works and a image minimally understandable, and for a long time that was my main objective, but once that point was over, I realized that my visualizations looked terrible, specially after comparing and reviewing other blogs and websites, so I…
Loading posts...