Blog
Ideas and comments about project management, agile methodologies and a little bit of everything.
-
![]()
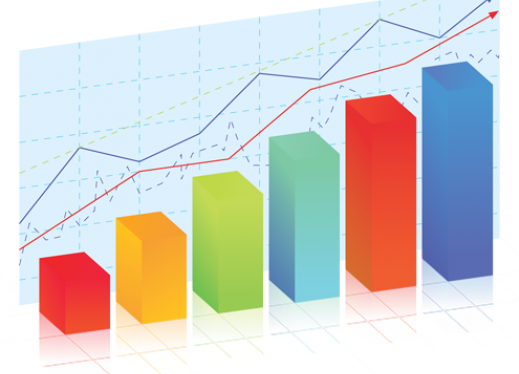
Normal distribution: what means in numbers?
Any process in which there are only random causes of variation follows a law of normal distribution. This condition that appears frequently in natural phenomena (hence it is called “normal”). When we evaluate what happens with a variable measured in a very large population, we find that these values form a bell shape. . .…
-
![]()
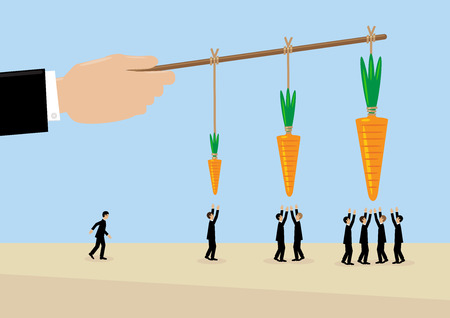
Economic incentives: real state transactions
“People respond to incentives.” Steve Levitt A few months ago, I decided to sell my house. While, in theory, it is a straightforward task, it isn’t clear. I received a couple of evaluations with a difference between them of 25%: for some agents, my house values X, and for others, it values X + 25%…
-
![]()
Exploring the replies from a question in Twitter using Python and R
One the most social phenomena in Twitter, are the open questions that anonymous users made to others. It is pretty common to see how simple questions like: What do you prefer: white wine or red white? What do you choose for your holiday: sea or mountain? passed by our timeline almost everyday, and in the…
-
![]()
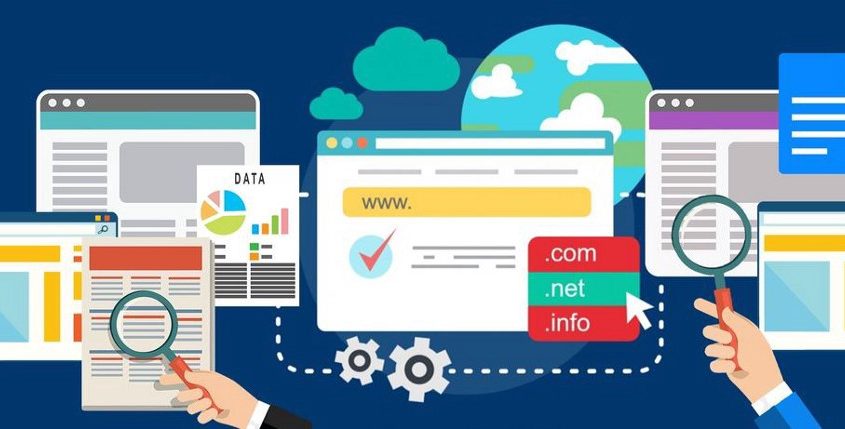
Web scraping using Beautiful Soup & Python: Wikipedia (II)
After executing my first test about how to use BeautifulSoup, the next step is trying to answer a question using information from different pages from Wikipedia, to check how easy it could solve a common issue. . Some questions that could be answered Are the inhabitants of the happiest cities in the world living in…
-
![]()
Web scraping using Beautiful Soup & Python: Wikipedia (I)
While the presence of a challenging task creates chaos, the most straightforward approach to solve a problem is usually to make our best effort, as the well-known quotes say: the world belongs to those who dare to dream. So, I am here trying to understand without almost no time, how to use BeautifulSoup (and Python)…
-
![]()
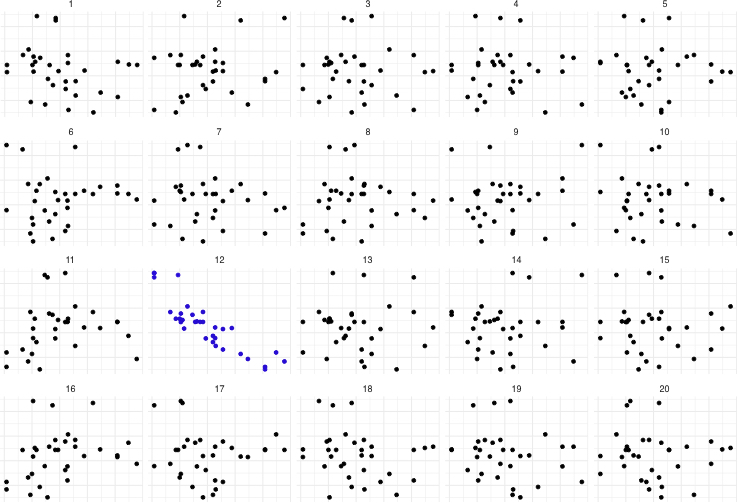
What is graphical inference?
The general idea of this post is to offer a brief summary of the meaning, the relevance, and the ways to use the concept of graphical inference to discover hidden patterns. Also, the general idea is to write this post in a plain language (instead of using an academic mindset) to understand the foundations. The…
-
![]()
5 Basic questions and answers about high dimensional data
The main idea of this post is to answer what high dimensional data is, its main challenges at the moment to create a visualization and offer examples about the adequate plots for this kind of data. If you master this area and you want to explore some papers, you can check some of them in…
-
![]()
5 Papers about high-dimensional data visualization
In this post I would like to share a small review about 1 article and 4 papers about how to manage visualization for high dimensional data. . 1. A tour through the visualization zoo The less academic article, and yet one of the best about visualization because it is elementary and provides a snapshot of…
-
![]()
Mini proyecto: Como hacer analisis de datos sobre un pequeño negocio (en Español)
Overview Si yo fuera dueño de una pequena empresa (Pyme) me gustaria poder analizar que dicen mis clientes acerca de mi negocio, cuales son los productos que mas y menos les gustan y cuales son sus quejas mas frecuentes. Si mi negocio fuera una cafeteria, me gustaria saber cual es el tipo de cafe que…
-
![]()
My experience at R unconference Chicago 2019
During the past weekend March 9th and 10th, I had the privilege to attend the RUnconference in Chicago. It was a fantastic event, where I got the chance to meet an incredible group of people and learn from them. What is an unconference? Inspired by the rOpenSci unconference series, the purpose of this event was encourage open…