Tag / how-to
-
![]()
How to create a heatmap (Updated!)
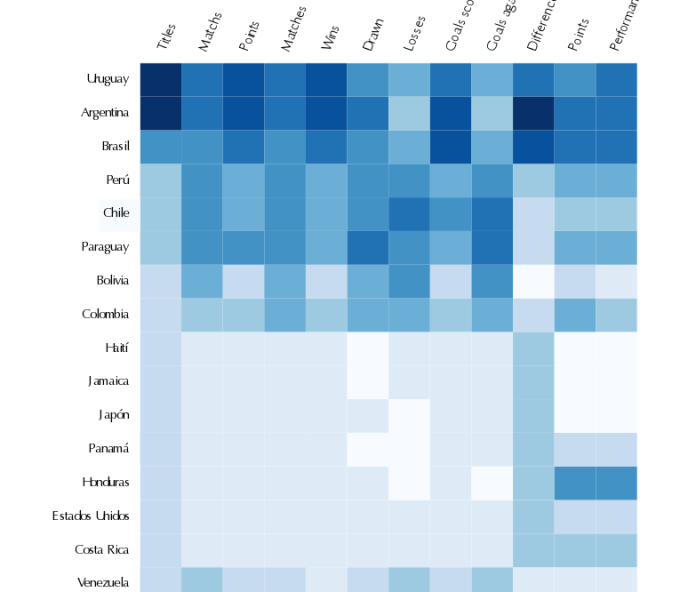
A heatmap is basically a table that has colors in place of numbers. Colors correspond to the level of the measurement. Each column can be a different metric like above. It’s useful for finding highs and lows and sometimes, patterns. From Nathan Yau | Visualize This One of the problems when we have a…
-
![]()
How to use pipeline operator %>%?
The pipeline operator %>% belong to the magrittr library, but from 2014 is included into the dplyr package, allowing us to concat multiple operations. Provide a mechanism for chaining commands with a new operator,%>%.This operator will send a value, or the result of an expression, to the next function. . What does it mean to concatenate functions? Let’s gonna check…
Loading posts...