Project step by step: What is the range of age with most players in the NFL?
A popular belief that has been considered valid throughout the centuries is the best way to understand an idea is to explain it to someone else. Seneca said so many centuries ago: “While we teach, we learn”.
Based on that I chose a very simple project in order to implement a histogram, firstly to break down the steps about how to use it, secondly because through this simplification we obtain very small, manageable pieces that facilitate understand the concepts behind each idea.
Definition of histogram
A histogram is a graphical method for displaying the shape of a distribution. It is particularly useful when there are a large number of observations.
The data
I will use a dataset with the 2,764 NFL players for all team rosters as of July 22, 2016. Some of the information includes jersey number, name, position, age, height (in inches), weight (in lbs), years in the NFL, college they graduated from, NFL team, position grouping (OL, QB, tailback, TE, WR, Front 7, DB, special teams), side of the football (offensive, defense or special teams), and their experience level by years played.
I mentioned all the elements of the data due to the completeness of this data set allow me to consider it to answer other questions and implement other tools.
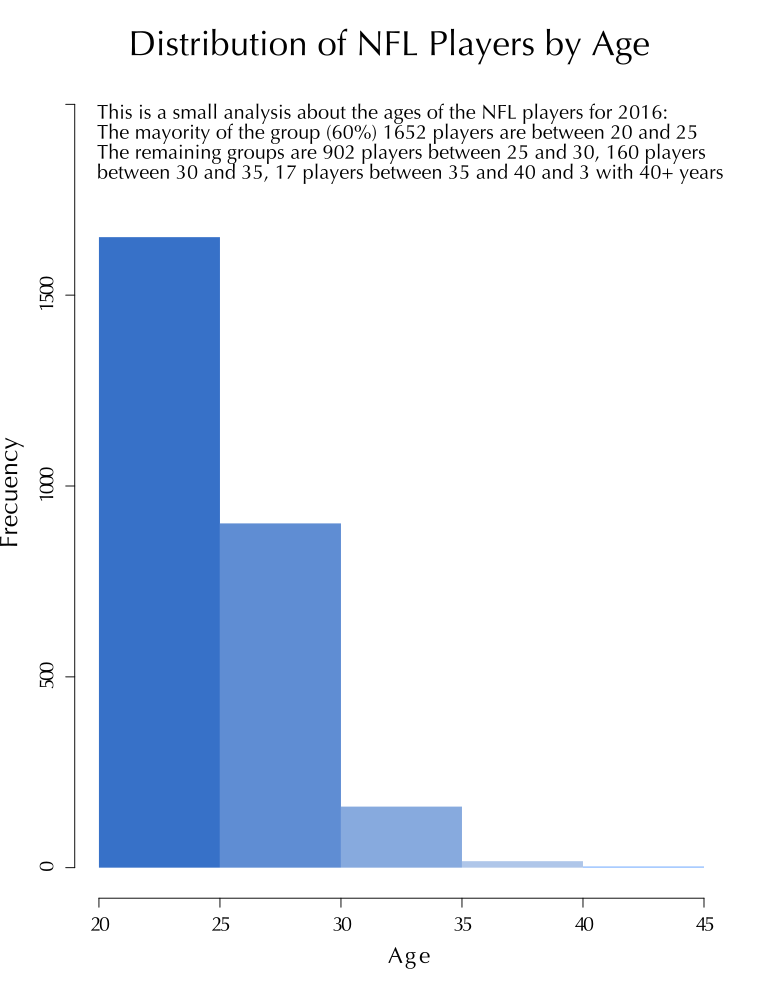
In this particular example in answer to the question What is the age range with most players in the NFL?, Considering the age of 2764 NFL players which are between 20 and 43 years.
Preliminary analysis of the data
| Interval’s Lower Limit | Interval’s Upper Limit | Class Frequency |
| 20 | 25 | 1652 |
| 25 | 30 | 902 |
| 30 | 35 | 160 |
| 35 | 40 | 17 |
| 40 | 42 | 3 |
This table shows the range of ages (intervals). The first interval is from 20 to 25, the second from 25 to 30, etc. In the next column, the number of players falling into each interval was counted to obtain the class frequencies.
Code
After to analyze the data, we can create an histogram in R:
#Load the data
nfl_2016 <- read.csv("NFL_Players_2016.csv")

#Cleaning the data
nfl_2016 = subset(nfl_2016, nfl_2016$Age != "--")
nfl_2016$Age <- as.numeric((as.character(nfl_2016$Age)))

hist(nfl_2016$Age,
 main="Distribution of NFL Players by Age",
 xlab="Age",
 col="blue",
 breaks=5,
 ylab="Quantity of players",
 ylim=c(0,2000)
 )
Final result
Sources
- Theory: http://onlinestatbook.com/2/graphing_distributions/histograms.html
- Dataset: https://www.statcrunch.com/5.0/shareddata.php?keywords=NFL