Author /
-
![]()
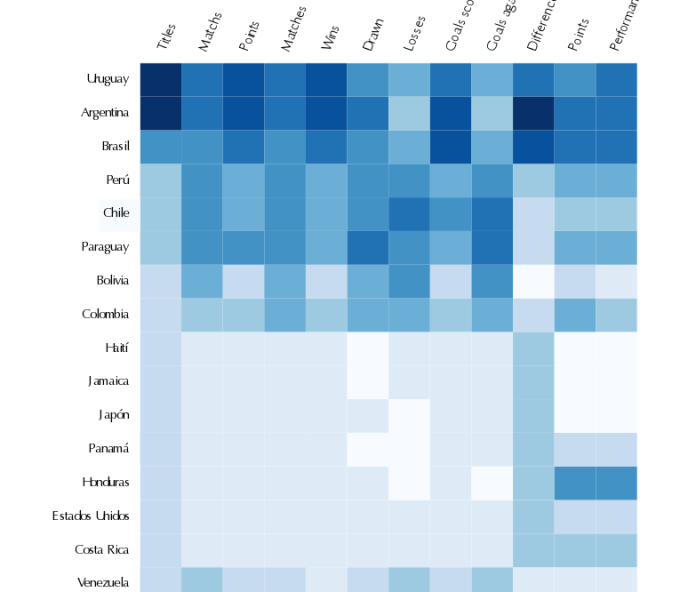
How to create a heatmap (Updated!)
A heatmap is basically a table that has colors in place of numbers. Colors correspond to the level of the measurement. Each column can be a different metric like above. It’s useful for finding highs and lows and sometimes, patterns. From Nathan Yau | Visualize This One of the problems when we have a…
-
![]()
Leer la Divina Comedia en el siglo XXI: #Dante2018 en Twitter
En estos dias se esta produciendo un fenomeno interesante en Twitter, la lectura colectiva de la Divina Comedia, sugerencia de un investigador argentino en Chicago, que tuvo un eco inesperado y que hizo que desde distintos puntos del planeta, cientos de usuarios lo estan viendo como una gran oportunidad de leer un clasico, y sentirse…
-
![]()
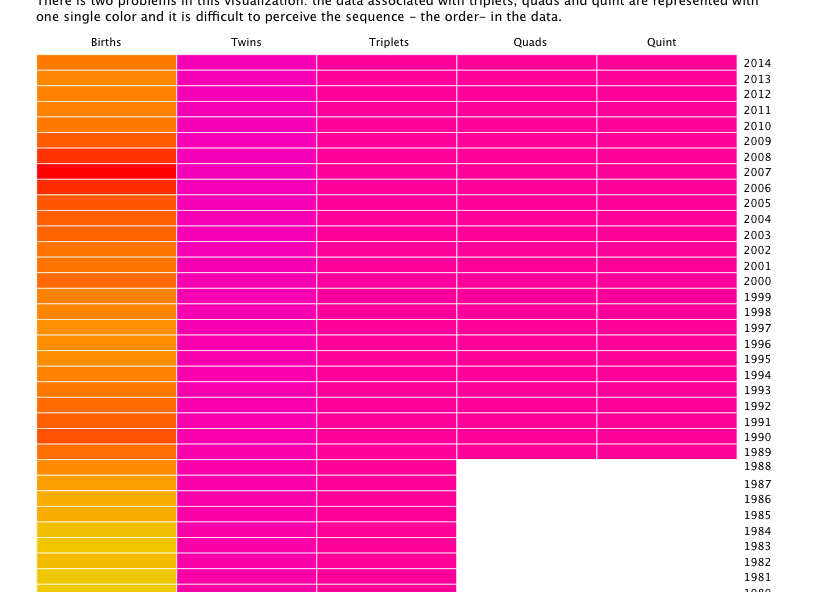
The use of color in data visualization
While I was working on one of my last visualizations, I needed much time than I expected because the incorporation of colors was extremely complicated. Here a small analysis about the reasons behind the fails to obtain a good visualization. The data The visualization is based on the stats about multiple births along the last…
-
![]()
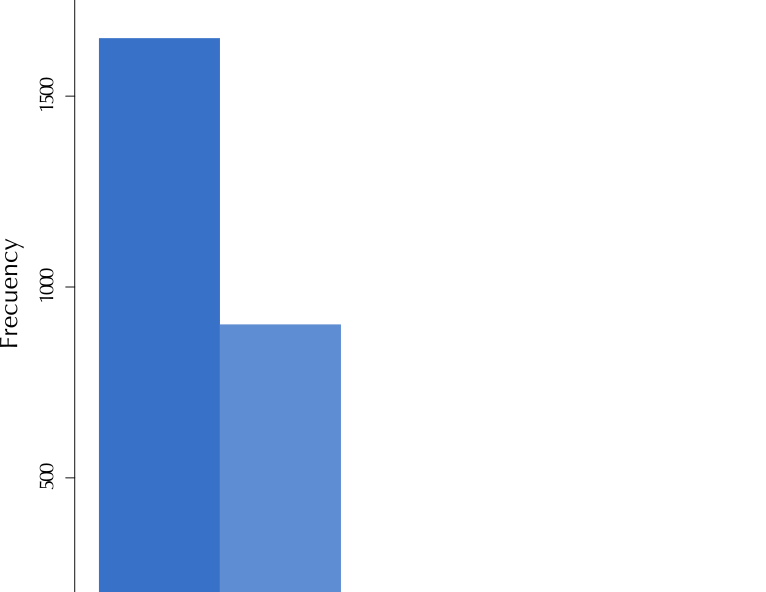
Project step by step: What is the range of age with most players in the NFL?
A popular belief that has been considered valid throughout the centuries is the best way to understand an idea is to explain it to someone else. Seneca said so many centuries ago: “While we teach, we learn”. Based on that I chose a very simple project in order to implement a histogram, firstly to break down…