Alluvial Diagram
Intro
Alluvial diagrams allow to graph data flows, where the width of the arrows is proportional to the amount of flow. Alluvial diagram is a variant of a Parallel Coordinates Plot (PCP) but for categorical variables.
What is the main benefit of using an Alluvial diagram? The simplicity to demonstrate the proportion, represented by the width of the lines. They also help visualize and understand data relationships in terms of proportion.
Similarities and differences with Parallel coordinates plot
The main function of PCP is used for plotting multivariate, numerical data. Parallel Coordinates Plots are ideal for comparing many variables together and seeing the relationships between them. For example, if you had to compare an array of products with the same attributes (comparing computer or cars specs across different models).
In a Parallel Coordinates Plot, each variable is given its own axis and all the axes are placed in parallel to each other. Each axis can have a different scale, as each variable works off a different unit of measurement, or all the axes can be normalised to keep all the scales uniform.
In parallel coordinates and alluvial diagrams, each axis can have at most two neighboring axes (one on the left, and one on the right). For a d-dimensional data set, at most d-1 relationships can be shown at a time. Finding a good axis arrangement requires the use of heuristics and experimentation. In order to explore more complex relationships, axes must be reordered.
The downside to Parallel Coordinates Plots, is that they can become over-cluttered and therefore, illegible when they’re very data-dense.
Alluvial diagram are used for plotting categorical data, not discrete data. Alluvial diagram divide the flow-path at each displayed line-set. The width of each line and the flow-path that stems from it is determined by the proportional fraction of the category total. Each flow can be colored to show and compare the distribution between different categories.
Alluvial diagram
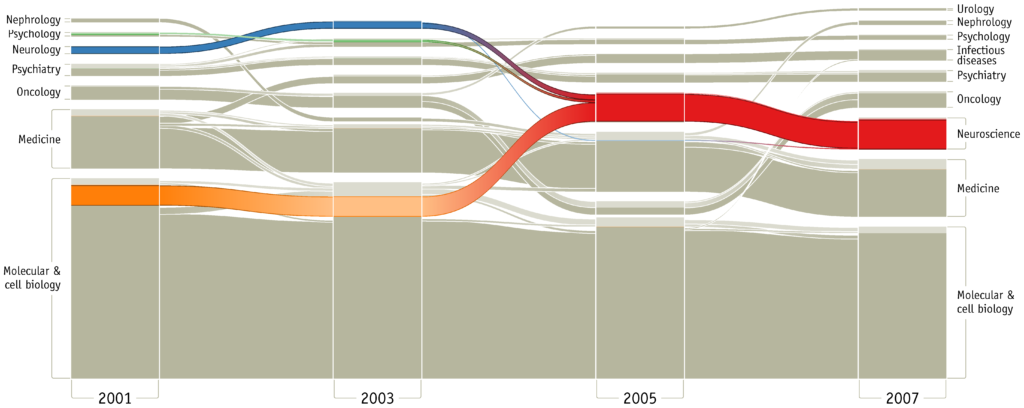
The first notice that we have about an alluvial diagram came from the paper “Mapping Change in Large Networks” by Martin Rosvall and Carl T Bergstrom, and the diagram represents changes in science.
Tools to create an Alluvial diagram
R packages
There are mainly two packages that you can use to create an alluvial diagram:
- ggalluvial package: Visually excellent. Easy to implement.
- alluvial package:Very good visuallization. Easy to implement.
References
- 1898. “Introductory Note on the Thermal Efficiency of Steam-Engines”. in: Minutes of Proceedings of the Institution of Civil Engineers.
- 2010. “Mapping Change in Large Networks“
- https://datavizcatalogue.com/methods/parallel_coordinates.html